Comparison of Criteria
Comparison of Criteria
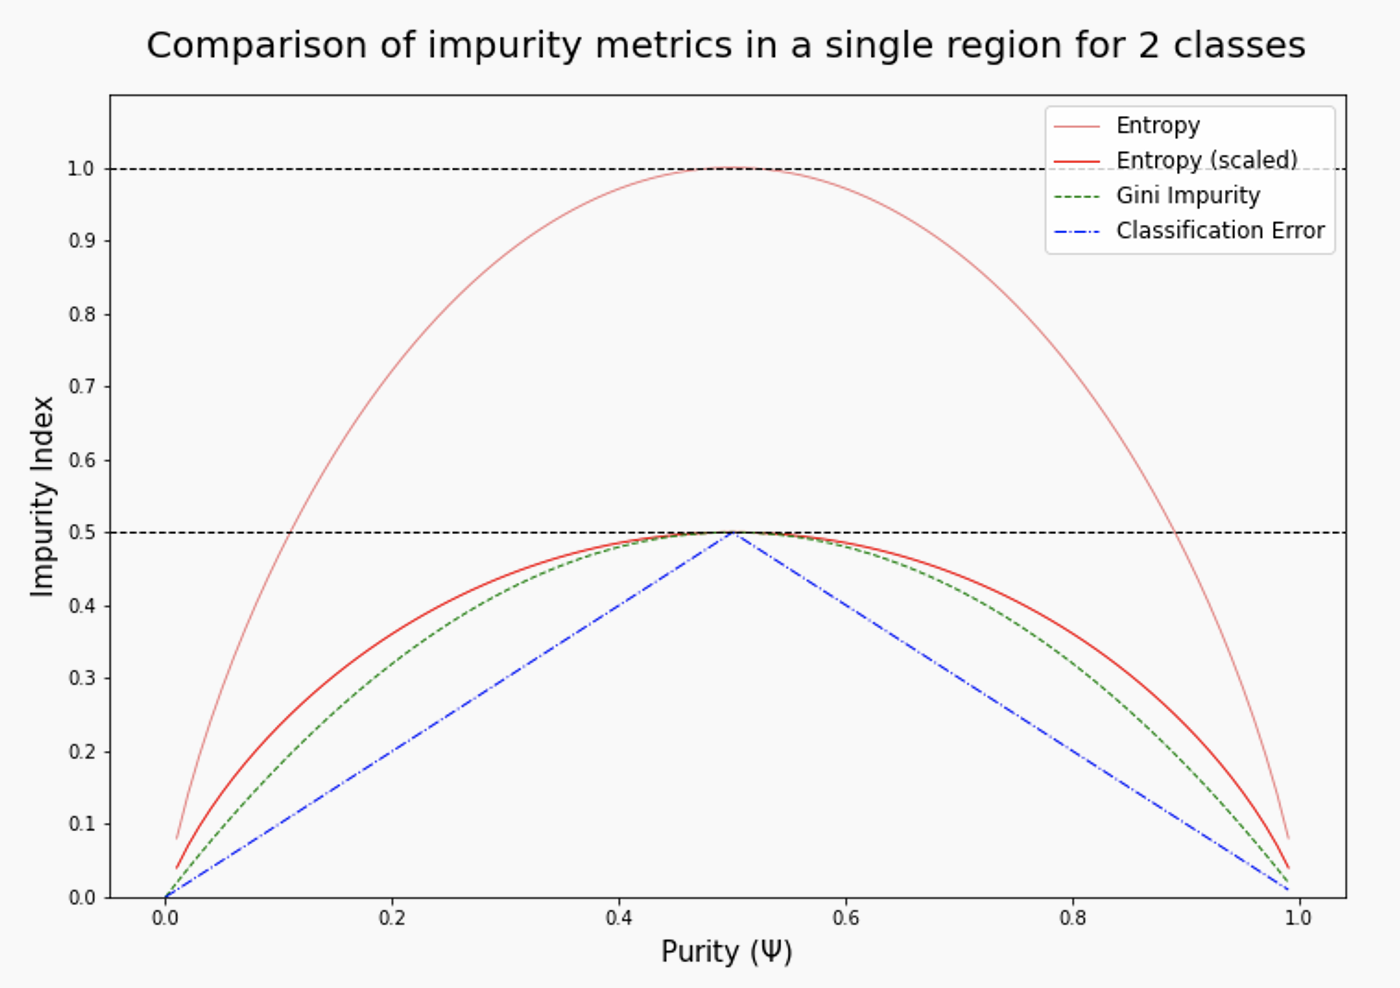
The graph below shows how our various impurity metrics compare for a fairly simple region with two classes. On the bottom is the purity Ψ You can see that all three measures reach a maximum around purity 0.5, but they take different paths to get there. For entropy and Gini impurity, they are curved (concave downward), while the classification error is a straight line from zero at both ends of the axis to a maximum in the center. None of these are "better", they just give different weights to different values of Ψ .
Learning the "optimal" decision tree for any given set of data is NP complete (intractable) for numerous simple definitions of "optimal". Instead, we will use a greedy algorithm that works as follows:
- Step 1
- Start with an empty decision tree (undivided feature space)
- Step 2
- Choose the "optimal" predictor on which to split, and choose the "optimal" threshold value for splitting.
- Step 3
- Recurse on each new node until stopping condition is met.
- Step 4
- For the case of classification, predict each region to have a class label based on the largest class of the training points in that region (Bayes' classifier).
This is not guaranteed to give us the best decision tree (for any particular definition of "best"), but it is very likely to give us a good one.
Comments
Post a Comment